The Greater Atlanta Coin Show began in 1988. With the recent volatility in the metals, especially gold and silver, it’s interesting to look at how the metals have performed through the years.
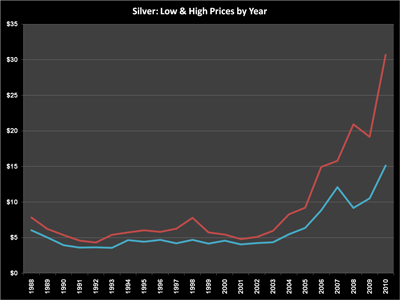
Just prior to the first show in 1988, silver’s value was $6.39. But, from 1988, silver began a downward trend. Its lowest point occurred in 1993 at $3.56. It enjoyed a high point in 1998 before dropping backward again. In 2008, silver topped $20 but it could not achieve above the $20 mark in 2009. In 2010 silver grew significantly to achieve a high value slightly greater than $30 per ounce, and of course, more recently, silver has enjoyed greater than $36 and greater than $37 per ounce relatively consistently. We’re not out of the first quarter yet, either.
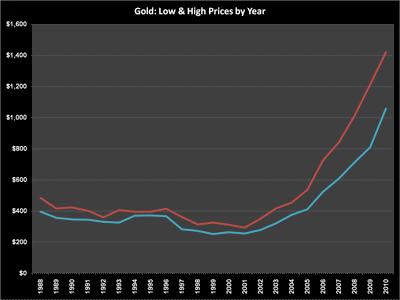
Gold, in its own way, is just as dramatic. Just prior to the first Greater Atlanta Coin Show, gold’s price was $441.70 per ounce. It, too, fell to a low point in 1993, but gold fell much further in the 1999 to 2001 years. Looking at the annual numbers, gold has been climbing ever since. It topped $800 in 2007, $1000 in 2008, $1200 in 2009 and $1400 in 2010. Gold hasn’t topped $1450 yet in the first quarter of 2011, but it has gotten close recently.
For simplicity, the silver and gold charts above show just the high and low values for each year from 1988 through 2010.
There are many more ups and downs through these years. More detail can be found at www.kitco.com with their historical charts.
In addition to looking at the overall growth patterns, it’s interesting to take a look at the equivalent 2011 dollars for the gold and silver values back in 1988.
For silver, it would take $11.95 of 2011 dollars to equate to the buying power of $6.39 in 1988, the price of silver just before the show.
Similarly for gold, $826.11 of 2011 dollars would be needed to go back in time to buy the ounce of gold at $441.70.
(These translations use the Bureau of Labor Statistics Inflation Calculator to determine equivalent buying power between years.)
The interesting and unknown factor is how high will the metals go?

