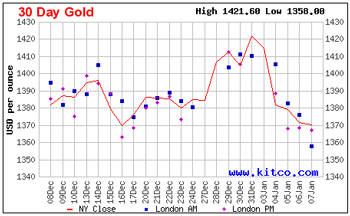
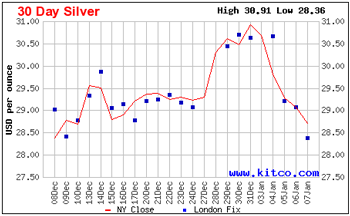
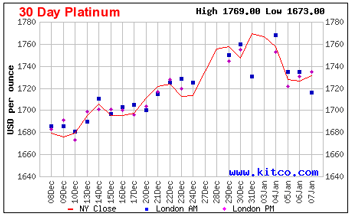
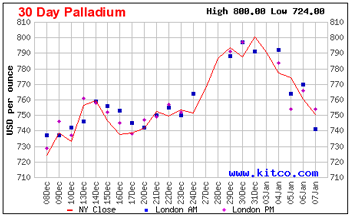
The metals that go up can also go down – way down as they did this past week. Just ouch.
Let’s look at the graphs. First, there’s gold:
Next is silver:
Platinum is third:
Palladium brings up the rear:
Just look at those graphs. Only platinum appears to have reached the valley. Though, who knows, it could also go further down. It will be interesting to see how the international markets treat the metals when they open later today. Of course, the charts above reflect the New York market’s close values for the metals. But, sometimes the foreign markets which open before the New York market can indicate the trend for the metals – up or down. Then, again, the foreign markets can do their own fluctuations independent of the New York values. The metals are definitely capricious.
Let’s look at the highs, lows and end of week values in their chart:
| 30 day high | 30 day low | Jan 7 Last | Difference between High and Low |
|
| Gold | $1,421.60 | $1,358.00 | $1,369.80 | 4.5% |
| Silver | $30.91 | $28.36 | $28.69 | 8.2% |
| Platinum | $1,769.00 | $1,673.00 | $1,731.00 | 5.4% |
| Palladium | $800.00 | $724.00 | $750.00 | 9.5% |
Well, January 7’s end of market values didn’t equate to the 30 day low, but a few of the metals got close.
Now, let’s compare the end of the first week in January to the end of the last week in December:
| Dec 31 Last | Jan 7 Last | Percent Change | Dollar Change |
|
| Gold | $1,421.60 | $1,369.80 | -3.6% | -$51.80 |
| Silver | $30.91 | $28.69 | -7.2% | -$2.22 |
| Platinum | $1,769.00 | $1,731.00 | -2.1% | -$38.00 |
| Palladium | $800.00 | $750.00 | -6.3% | -$50.00 |
Just painful. Gold had the biggest dollar difference with palladium not far behind. On the other hand, silver had the largest percentage drop, again with palladium not far behind.
The economic and political turmoil continues, domestically and abroad. The metals’ values respond to that turmoil – sometimes positively and sometimes negatively. It’s interesting to watch the metals and the pundits who predict which way the values will go. It could be an interesting exercise to see how successful the predictors really are rather than how successful they say they are.
We’ll just predict the metals prices will go up, stay roughly the same or go down – to cover all the bases! That’s a joke since we have no clue which way they will go. The metals and their values are fun to watch, but they can also be nerve-wracking if you watch too closely.
What will next Friday’s graphics and charts show – up or down? Let’s say up and strive for the best! Stay tuned.


