Check out our new book: Days of Our Coins Volume I
>>>>>>
For years, the metals’ market prices crept up or down within a small, at least relatively speaking, dollar range. Now, it’s not uncommon for them to climb or fall by a much larger amount.
This week, two metals started the week climbing only to begin falling on Tuesday. The other two metals began their week falling.
Let’s take a look.
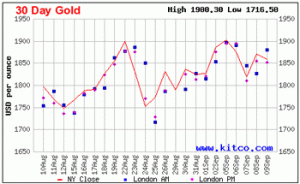
First, there’s gold:
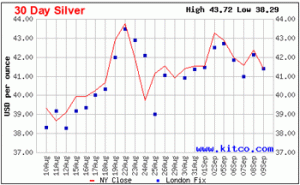
Next is silver:
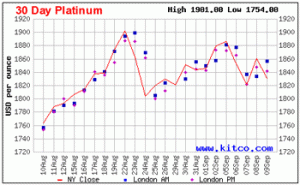
Third is platinum:
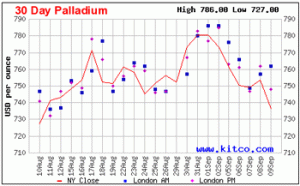
Fourth is palladium:
Just look at the gold chart. It’s difficult to see, but gold closed at over $1900 on Monday, breaking into a new level for the golden metal. Tuesday and Wednesday’s gold markets lost all of the gains from the previous five business days. But, on Thursday gold started back upward with a significant gain then turned around to end the week down slightly.
Silver behaved somewhat differently. It began the week down from the previous Friday’s closing market and continued to fall through Tuesday and Wednesday. Thursday’s silver market regained some of the losses, but Friday’s downturn placed the closing value below that of the previous five business days.
Similar to gold but not with the same numbers, platinum started the week going upward then Tuesday and Wednesday’s markets lost the gains made during the last week. On Thursday, platinum started back upward only to fall again on Friday. It didn’t lose quite all of its Thursday gain but almost.
Palladium continues to have a tough time on the market. It continued its downward motion, begun the previous Friday, through Wednesday. Thursday’s palladium markets enjoyed a small increase which was lost with another significant decrease at the end of the week. Again, palladium is the odd metal out.
The rolling 30-day high and low values for the metals provide interesting insights:
| 30 day high | 30 day low | Sep 9 Last | Difference between High and Low |
|
| Gold | $1,900.30 | $1,716.50 | $1,858.60 | 9.7% |
| Silver | $43.72 | $38.29 | $41.38 | 12.4% |
| Platinum | $1,901.00 | $1,754.00 | $1,830.00 | 7.7% |
| Palladium | $786.00 | $727.00 | $736.00 | 7.5% |
Gold shows another all-time high with its $1900.30 value. The other metals have some new highs and lows mostly due to the previous values moving off the 30-day window.
The percentage difference between the highs and lows provide an interesting indicator of the swings in the market. Silver continues to have the widest swings, but gold is not far behind.
As the charts show, the metals all lost this week. Let’s compare week over week ending numbers:
| Sep 2 Last | Sep 9 Last | Percent Change | Dollar Change |
|
| Gold | $1,884.20 | $1,858.60 | -1.4% | -$25.60 |
| Silver | $43.25 | $41.38 | -4.3% | -$1.87 |
| Platinum | $1,878.00 | $1,830.00 | -2.6% | -$48.00 |
| Palladium | $773.00 | $736.00 | -4.8% | -$37.00 |
This week platinum had the largest dollar decrease while palladium encountered the largest percentage decrease.
Another table of interest compares the gold and platinum closing numbers. For a long time, platinum was always higher than gold. That’s not the case now:
| mon | tue | wed | thu | fri | |
| gold | $1,900.30 | $1,873.60 | $1,817.30 | $1,869.60 | $1,858.60 |
| platinum | $1,885.00 | $1,852.00 | $1,820.00 | $1,860.00 | $1,830.00 |
Only one day had platinum closing above gold. Amazing.
With all of the political and economic issues, the metals will remain volatile and interesting to watch.
<<<<<<<
Check out our new book: Days of Our Coins Volume I


