Coin Show - Gold Charts
Gold prices fluctuated with several ups and downs in the past year.
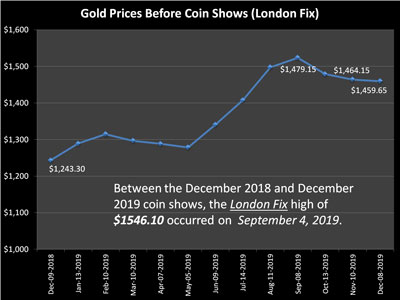
In comparison, the gold prices prior to the December 2018 and the recent December 2019 coin shows include a year-over-year increase of $216.35 or 17.4%.
In comparing to the last coin show, gold is down $4.50 or 0.3% from the Friday before the November show to the Friday before the December show.
Gold's price dramatically changed throughout the coin show years.
Gold enjoyed its highest value of 2018 in January. From there, the values began an up and down trend with its overall value moving downward.
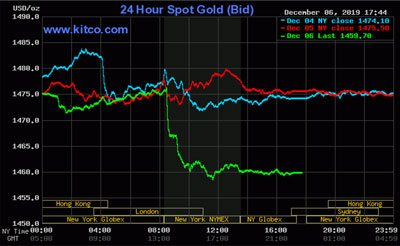
Let's look at the New York closing values for gold on the last trading day before the December 2019 coin show:
Let's look at the New York closing values for gold on the last trading day before the December 2019 coin show:
The New York market closed at $1459.70 on the Friday before the December show, while the London market closed at $1459.65.
Take a look at this chart of the gold prices for December 2018 through December 2019.
Each of these values reflect the prices on the Friday just prior to the monthly coin shows (London Market values).
Take a look at this chart of the gold prices for December 2018 through December 2019.
Each of these values reflect the prices on the Friday just prior to the monthly coin shows (London Market values).
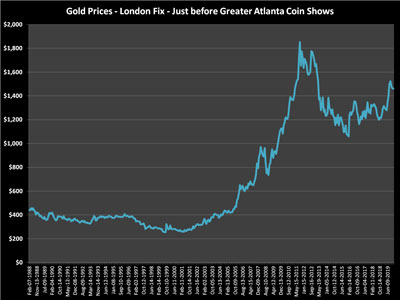
Back when the Greater Atlanta Coin Show started in 1988, gold's price was $441.70 per troy ounce. Through the years, gold bullion prices climbed and fell, falling in 1993 to a low point of $326.10 per ounce. Climbing again, gold's values trended upward for a handful of years but fell to a new low in 1999 of $252.80.
In 2011, gold's prices reached new record highs.
The charts have been updated to include through the Friday of the most recent show.
This chart shows the gold prices from the London PM Fix numbers on the Friday just prior to each coin show through all the coin show years, 1988-to-date.
In 2011, gold's prices reached new record highs.
The charts have been updated to include through the Friday of the most recent show.
This chart shows the gold prices from the London PM Fix numbers on the Friday just prior to each coin show through all the coin show years, 1988-to-date.
The numbers for the gold prices in the charts above were pulled from Kitco's historical gold data using London Fix values. Click on historical gold information to review Kitco's much more detailed data and charts.
Their site provides much more detail of the daily values through these years rather than just the days before coin shows and the singular high and low points as shown in the above gold charts.
Their site provides much more detail of the daily values through these years rather than just the days before coin shows and the singular high and low points as shown in the above gold charts.
© Copyright Atlanta Coin Expositions, 2008-2025. All Rights Reserved.
Several of the links on the pages within this web site go to affiliate vendors.
A vendor affiliation can mean a small monetary compensation to the web site owner at no additional cost to you.
Several of the links on the pages within this web site go to affiliate vendors.
A vendor affiliation can mean a small monetary compensation to the web site owner at no additional cost to you.
Coin Show
Information
Shop
General


Not updated as of January 2020
