Let’s take a look at the metals’ performance this week. The world’s political situation and the corresponding economic turmoil have played havoc with the markets in the last couple of weeks. But, what did the metals do?
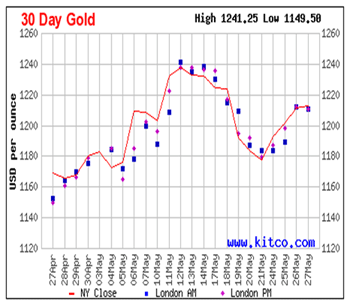
Here’s gold:
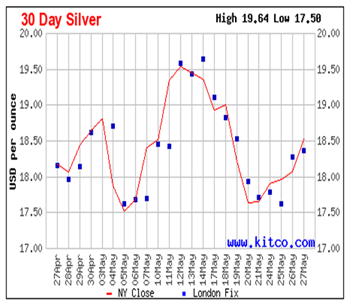
Next, there’s silver:
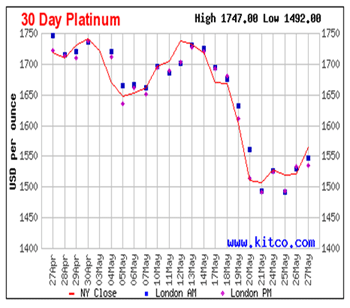
And, platinum, that beautiful white precious metal:
Last, a versatile favorite, palladium:
Each of the metals climbed from where we left them last Friday. Let’s look at the end of day information for last Friday versus today:
| May 21 Last | May 28 Last | Percent Change Increase(+) Decrease(-) Percent |
|
| Gold | $1,177.00 | $1,214.30 | 3.2% |
| Silver | $17.64 | $18.37 | 4.1% |
| Platinum | $1,505.00 | $1,545.00 | 2.7% |
| Palladium | $434.00 | $457.00 | 5.3% |
What about the rolling 30 day highs and 30 day lows?
| 30 day high | 30 day low | May 28 Last | Difference between High and Low |
|
| Gold | $1,241.25 | $1,149.50 | $1,214.30 | 7.4% |
| Silver | $19.64 | $17.50 | $18.37 | 10.9% |
| Platinum | $1,747.00 | $1,492.00 | $1,545.00 | 14.6% |
| Palladium | $562.00 | $415.00 | $457.00 | 26.2% |
Palladium continues to be the most volatile but also the most fun to watch.
Yes, the investment pundits focus on gold and and silver for the most part. But, if you look at the wide variety of industrial uses, in addition to car parts, for palladium, the metal should be in more demand. Plus, you wonder why industry would use the more expensive platinum when palladium costs much less.
The mining experts don’t think that palladium’s price will catch platinum’s but they do think the difference is too broad.
And, it’s interesting that both platinum and palladium are just as scarce and just as difficult, if not more so, to mine than gold.


