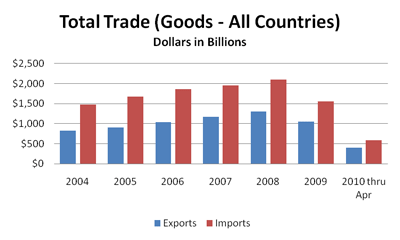
Continuing yesterday’s theme but at a higher level, let’s look at the total trade with the world for the last six years plus the first four months of 2010.
First, our imports in Goods far exceeds our exports. The source of this information comes from the Census Bureau’s Foreign Trade statistics. Though the US does export Services, these statistics only include Goods.
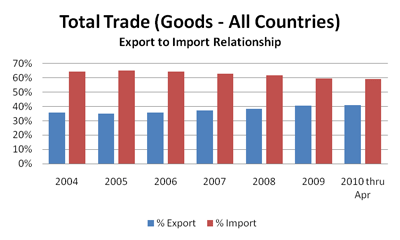
The amounts are staggering when you consider these values are in billions of dollars. But, perhaps a more disconcerting way to look at the information is the percentage graph. To have equitable trade, the bars should be roughly equal in height. Instead, the import bars are much larger. The good news is they decrease over time but not significantly.
Also of interest is the review of the top trade partners during this time. The top five jockeyed their rank position over the years, but they remained constant. They are Canada, Mexico, China, Japan and Germany.
Let’s look at their information:
| Total Trade (Goods) | |||||||
| Rank | Country | Exports | % Export | Imports | % Import | Total Trade | % of Total |
| 2004 | Total, All | 819.0 | 36% | 1471.0 | 64% | 2289.6 | 100.00% |
| 1 | Canada | 190.2 | 43% | 255.9 | 57% | 446.1 | 19.50% |
| 2 | Mexico | 110.8 | 42% | 155.8 | 58% | 266.6 | 11.60% |
| 3 | China | 34.7 | 15% | 196.7 | 85% | 231.4 | 10.10% |
| 4 | Japan | 54.4 | 30% | 129.6 | 70% | 184.0 | 8.00% |
| 5 | Germany | 31.4 | 29% | 77.2 | 71% | 108.6 | 4.70% |
| Rank | Country | Exports | % Export | Imports | % Import | Total Trade | % of Total |
| 2005 | Total, All | 904.3 | 35% | 1671.4 | 65% | 2575.7 | 100.00% |
| 1 | Canada | 211.3 | 42% | 287.9 | 58% | 499.2 | 19.40% |
| 2 | Mexico | 120.0 | 41% | 170.2 | 59% | 290.2 | 11.30% |
| 3 | China | 41.8 | 15% | 243.5 | 85% | 285.3 | 11.10% |
| 4 | Japan | 55.4 | 29% | 138.1 | 71% | 193.5 | 7.50% |
| 5 | Germany | 34.1 | 29% | 84.8 | 71% | 119.0 | 4.60% |
| Rank | Country | Exports | % Export | Imports | % Import | Total Trade | % of Total |
| 2006 | Total, All | 1037.3 | 36% | 1855.4 | 64% | 2892.7 | 100.00% |
| 1 | Canada | 230.6 | 43% | 303.4 | 57% | 534.0 | 18.50% |
| 2 | China | 55.2 | 16% | 287.8 | 84% | 343.0 | 11.90% |
| 3 | Mexico | 134.2 | 40% | 198.3 | 60% | 332.4 | 11.50% |
| 4 | Japan | 59.6 | 29% | 148.1 | 71% | 207.7 | 7.20% |
| 5 | Germany | 41.3 | 32% | 89.1 | 68% | 130.4 | 4.50% |
| Rank | Country | Exports | % Export | Imports | % Import | Total Trade | % of Total |
| 2007 | Total, All | 1163.3 | 37% | 1953.6 | 63% | 3117.0 | 100.00% |
| 1 | Canada | 248.9 | 44% | 313.1 | 56% | 562.0 | 18.00% |
| 2 | China | 65.2 | 17% | 321.5 | 83% | 386.7 | 12.40% |
| 3 | Mexico | 136.5 | 39% | 210.8 | 61% | 347.3 | 11.10% |
| 4 | Japan | 62.7 | 30% | 145.5 | 70% | 208.1 | 6.70% |
| 5 | Germany | 49.7 | 35% | 94.4 | 66% | 144.0 | 4.60% |
| Rank | Country | Exports | % Export | Imports | % Import | Total Trade | % of Total |
| 2008 | Total, All | 1300.5 | 38% | 2100.4 | 62% | 3400.9 | 100.00% |
| 1 | Canada | 261.4 | 44% | 335.6 | 56% | 596.9 | 17.60% |
| 2 | China | 71.5 | 17% | 337.8 | 83% | 409.2 | 12.00% |
| 3 | Mexico | 151.5 | 41% | 215.9 | 59% | 367.5 | 10.80% |
| 4 | Japan | 66.6 | 32% | 139.2 | 68% | 205.8 | 6.10% |
| 5 | Germany | 54.7 | 36% | 97.6 | 64% | 152.3 | 4.50% |
| Rank | Country | Exports | % Export | Imports | % Import | Total Trade | % of Total |
| 2009 | Total, All | 1056.9 | 40% | 1558.1 | 60% | 2615.0 | 100.00% |
| 1 | Canada | 204.7 | 48% | 224.9 | 52% | 429.6 | 16.40% |
| 2 | China | 69.6 | 19% | 296.4 | 81% | 366.0 | 14.00% |
| 3 | Mexico | 129.0 | 42% | 176.5 | 58% | 305.5 | 11.70% |
| 4 | Japan | 51.2 | 35% | 95.9 | 65% | 147.1 | 5.60% |
| 5 | Germany | 43.3 | 38% | 71.3 | 62% | 114.6 | 4.40% |
| Rank | Country | Exports | % Export | Imports | % Import | Total Trade | % of Total |
| 2010 thru Apr |
Total, All | 399.1 | 41% | 580.4 | 59% | 979.5 | 100.00% |
| 1 | Canada | 78.6 | 47% | 90.4 | 53% | 169.0 | 17.30% |
| 2 | China | 27.7 | 22% | 98.8 | 78% | 126.5 | 12.90% |
| 3 | Mexico | 50.3 | 41% | 71.1 | 59% | 121.4 | 12.40% |
| 4 | Japan | 19.0 | 34% | 36.8 | 66% | 55.9 | 5.70% |
| 5 | Germany | 15.3 | 39% | 24.4 | 61% | 39.7 | 4.10% |
It’s interesting to see the disparate values with these trade partners. Yes, we do also export Services, however even including the services, the balance is not equitable. (The Census Bureau’s Foreign Trade group includes statistics for both Goods and Services in a high level report. This report was just released earlier in June.)
Though general in nature, these foreign trade characteristics play a role in the world’s economy, the value of the dollar in relation to world currencies and the metals markets, gold, in particular.
The next time you read economic news, remember these trade practices and comparisons.

