It used to be that silver was called the “poor man’s gold.” Now, with the increased silver rates, copper gains the similar name of “poor man’s silver.”
For interest and education, let’s take a look at copper over the years.
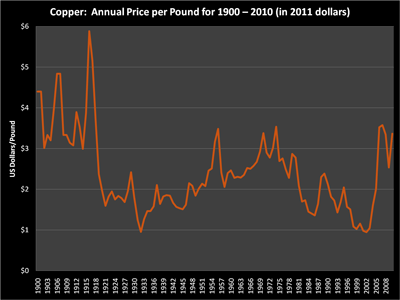
This first graph includes the average annual rate for copper in US dollars per pound with the dollars adjusted for inflation through the years to 2011 values.
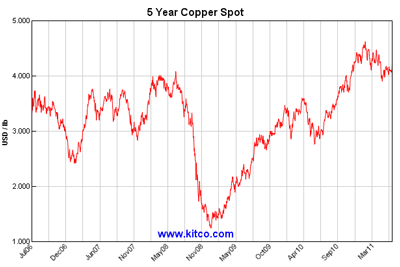
Back in the nineteen-teens, the rate per pound climbed to almost $6 in today’s dollars. Last year, the rate averaged close to $3.50. This year the rate has increased as evidenced in this more detailed five-year value chart.
The current copper values are bouncing around the $4.20 per pound rate.
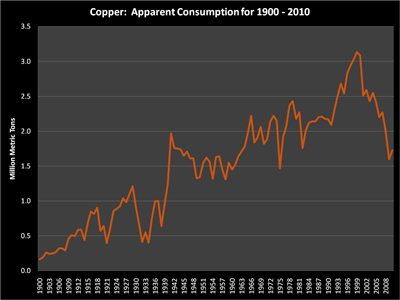
But, along with rates, what is the demand for the metal? This chart looks at “apparent consumption” in millions of metric tons across the time span of 1900 through 2010.
The peak was in the 1999-2000 years with a small uptick in need during 2010.
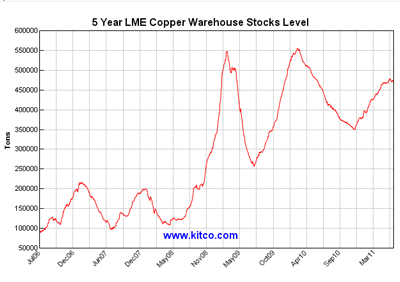
Also important to price is the warehoused amount of copper as seen in this next chart.
Companion to the increase in consumption values is a corresponding increase in warehouse values starting into 2011.
Now, looking at the charts above, it’s somewhat odd to note that at the peak consumption occurred at roughly the same time as the cheapest prices within the last 20 years. But, too, that can be explained by cheaper prices driving a stockpiling effort.
Normally, we talk about high demand and low supply driving prices up. On the other hand, large supplies and cheap prices can increase demand especially if the future need is known and warehouse space is available.
But, just look, if someone had purchased a relatively large amount of copper in 1999 at $1.03 per pound. Selling today at $4.25 per pound would achieve a sizable profit.
Going forward, is copper a good investment? That’s almost like asking what’s the weather going to be on the fourth Sunday in October. There will be weather on that Sunday, but will it be nice or nasty – no one knows.
As a last comment in their information, the USGS includes the following:
Substitutes: Aluminum substitutes for copper in power cables, electrical equipment, automobile radiators, and cooling and refrigeration tube; titanium and steel are used in heat exchangers; optical fiber substitutes for copper in telecommunications applications; and plastics substitute for copper in water pipe, drain pipe, and plumbing fixtures.
Will substitutes overtake the need for copper? Maybe, but how many other, newer requirements for the copper metal are being identified?
As always, each person needs to do their own research into the viability of copper as a “poor man’s silver” or as a collectible.
Resources:
Kitco Copper Charts – historical
Kitco Current Copper Spot Values


