Yes, today is Monday, but the graphics and charts are from Friday. Sometimes, other priorities take precedence over the blog.
Talk about a week where the metals were volatile – the last week saw some major dips and major climbs. Of course, the election day on Tuesday played a role, but other factors contributed as well.
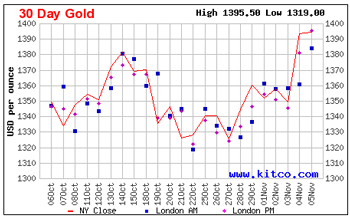
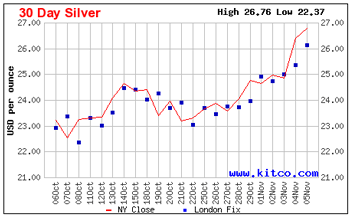
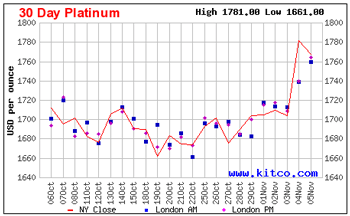
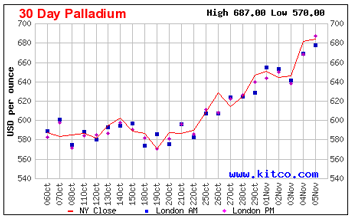
Let’s take a look at the 30 day performance charts. Due to when they were captured, these charts include all five days of the last week.
First, there’s gold:
Next, there’s silver, the metal worth watching closely:
Then, there’s platinum:
Last of the four, but still very interesting – just look at that upward climb, is palladium:
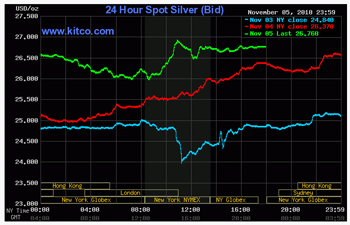
Though not reflected in the above charts which only show the close numbers for each day, the metals market dropped dramatically on Wednesday but picked back up somewhat before the close. Then on Thursday, the metals not only fully recovered, but they climbed even higher.
This silver chart tells the tale by showing Wednesday, Thursday and Friday for the New York trading business day. The bottom line demonstrates the market on Wednesday with its dramatic drop around midday. The middle line graph shows the Thursday market with the top line representing Friday’s ups and downs with the day’s ending silver values higher than when the New York market opened.
Let’s look at the numbers for the 30-Day highs and lows along with the week’s closing values:
| 30 day high | 30 day low | Nov 5 Last | Difference between High and Low |
|
| Gold | $1,395.50 | $1,319.00 | $1,394.10 | 5.5% |
| Silver | $26.76 | $22.37 | $26.76 | 16.4% |
| Platinum | $1,781.00 | $1,661.00 | $1,767.00 | 6.7% |
| Palladium | $687.00 | $570.00 | $683.00 | 17.0% |
Just look at those numbers. Gold is an all time high, and silver is as high as it has been since the 1980s.
In comparison to the previous week, which could have been interpreted as the beginning of a downward fall, the metals gained quite a bit.
| Oct 29 Last | Nov 5 Last | Percent Change | Dollar Change |
|
| Gold | $1,359.60 | $1,394.10 | 2.5% | $34.50 |
| Silver | $24.74 | $26.76 | 8.2% | $2.02 |
| Platinum | $1,703.00 | $1,767.00 | 3.8% | $64.00 |
| Palladium | $646.00 | $683.00 | 5.7% | $37.00 |
Platinum as the most expensive metal gained the most dollars in the week over week comparison, but once again, silver had the biggest percentage gain.
In looking at the three-day silver chart above, an amazing difference occurs just before noon between Wednesday and Friday. The rate went from just under $24 at midday on Wednesday to just under $27 at midday on Friday. That big of a jump in that short of a time period is almost unheard of within the silver market.
Of course, some pundits claim the silver market will continue to rise rapidly, we’ll have to wait to see.
Keep watch. The metals will continue to be entertaining – all of them.
