When we think of metals we subconciously think of something heavy instead of something light like a feather. That can be good, especially when their values drop like something heavy such as a rock.
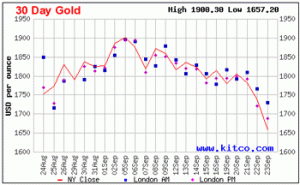
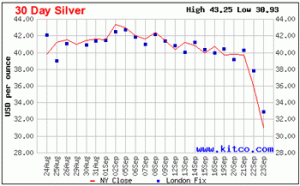
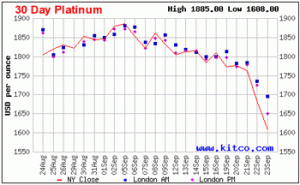
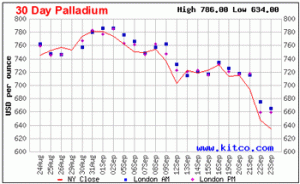
All four metals ended the week down, way down to new recent low values. Let’s look at the charts.
First, there’s gold:
Next is silver:
Third is platinum:
Fourth is palladium:
Just ouch…like rocks falling off a cliff…
Though the metals’ ups and downs varied in amounts and percentages, all four followed the same path.
Monday’s New York metals’ market dropped from the previous Friday’s closing values. Tuesday’s market saw an increase in all four metals with gold recovering more than the other three. Wednesday’s market started the downturn which continued for the rest of the week.
Let’s look at the highs and lows for the 30-day period:
| 30 day high | 30 day low | Sep 23 Last | Difference between High and Low |
|
| Gold | $1,900.30 | $1,657.20 | $1,657.20 | 12.8% |
| Silver | $43.25 | $30.93 | $30.93 | 28.5% |
| Platinum | $1,885.00 | $1,608.00 | $1,608.00 | 14.7% |
| Palladium | $786.00 | $634.00 | $634.00 | 19.3% |
All four ended the week with new low points. Just look at the percentage difference between the high and low points for the period. Silver’s swing in value is almost 30% with palladium at almost 20%. Gold and platinum with their larger numbers do not have as much percentage difference, but they do vary widely in actual dollar differences.
For example, let’s take a look at the week’s ending values for the metals, week-over-week:
| Sep 16 Last | Sep 23 Last | Percent Change | Dollar Change |
|
| Gold | $1,812.50 | $1,657.20 | -8.6% | -$155.30 |
| Silver | $40.66 | $30.93 | -23.9% | -$9.73 |
| Platinum | $1,809.00 | $1,608.00 | -11.1% | -$201.00 |
| Palladium | $730.00 | $634.00 | -13.2% | -$96.00 |
Those are some wide swings in just one week’s time. Silver experienced the largest percentage drop, but platinum fell the most in dollars.
It’s also interesting to see how the metals fared at the end of the New York market each day:
| mon | tues | wed | thu | fri | |
| gold | $1,778.50 | $1,804.80 | $1,780.50 | $1,736.20 | $1,657.20 |
| platinum | $1,772.00 | $1,776.00 | $1,761.00 | $1,682.00 | $1,608.00 |
| silver | $39.65 | $39.74 | $39.62 | $35.84 | $30.93 |
| palladium | $713.00 | $714.00 | $693.00 | $647.00 | $634.00 |
Look at gold and platinum. Platinum continues to follow behind gold, when for years it was the more expensive metal of the four.
But take a look at silver. It dropped a dollar on Monday, picked up a few cents on Tuesday, lost a few cents on Wednesday, fell almost four dollars on Thursday and almost five dollars on Friday. That’s significant.
Gold’s decrease was also significant, though neither the largest dollar nor the most percentage loss. Monday’s gold saw a decrease of $34 of which $26.30 was regained on Tuesday. Next, gold began its fall by dropping $24.30 on Wednesday, $44.30 on Thursday and $79 on Friday.
What happened?
Some claim that the metals were sold to cover losses in the stock market. Or could it be those who dipped their toes into the metals market panicked and sold driving the market prices downward?
As one dealer put it, “Where would you prefer to invest your assets – in stock, the dollar, real estate or the metals?” At least with the metals – especially gold and silver, they have historically retained their value in tough economic times.
Each individual must perform their own research and make their own investing decision. Savvy investors will take this drop in market price to buy physical silver and gold – if they can find it.
Next week’s market should be interesting…


