Yes, it’s Saturday morning after the holiday on Thursday, but the metals’ market was open yesterday – at least for part of the day.
Let’s take a look at the charts. Notice the charts include all five days of the most recent week.
First is gold:
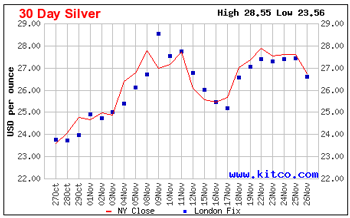
Next is silver:
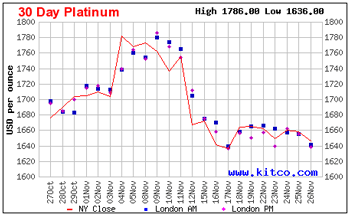
Third is platinum:
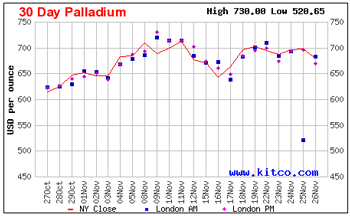
Fourth and last is palladium:
Perhaps the most interesting aspect of the charts is their lack of similarity. Historically, the gold and silver charts followed similar ups and downs. Likewise, platinum and palladium had similar line charts. In the past, one could hold each pair of charts one over the other and not see much variation in the lines. Now, the metals’ values vary when they go up and down and in the highs and lows of the charts’ lines.
For example, in the charts above, gold peaked on Tuesday whereas silver achieved its high for the week on Monday. Platinum and palladium had similar charts for the week as both began on a downward trend to Tuesday then back up on Wednesday and Thursday and ending the week down again. But, if you look at the month, the two white metals vary significantly.
Let’s take a look at the numbers:
| 30 day high | 30 day low | Nov 26 Last | Difference between High and Low |
|
| Gold | $1,421.00 | $1,324.50 | $1,364.20 | 6.8% |
| Silver | $28.55 | $23.56 | $26.70 | 17.5% |
| Platinum | $1,786.00 | $1,636.00 | $1,646.00 | 8.4% |
| Palladium | $730.00 | $520.65 | $679.00 | 28.7% |
There’s an interesting anomaly with palladium. If you look at the chart, the line graph does not fall below $600. (Actually, the lowest point is closer to $617.) Looking more closely, there is a small blue (London AM) point on Thursday of this week that equals the low value of $520.65.
Perhaps the close of the US markets for the Thanksgiving Day holiday impacted the market. Though, overall, three of the metals rose slightly on their close between Wednesday and Thursday with platinum the only metal to decrease – and only slightly.
Let’s look at the week over week performance:
| Nov 19 Last | Nov 26 Last | Percent Change | Dollar Change |
|
| Gold | $1,354.10 | $1,364.20 | 0.7% | $10.10 |
| Silver | $27.35 | $26.70 | -2.4% | -$0.65 |
| Platinum | $1,664.00 | $1,646.00 | -1.1% | -$18.00 |
| Palladium | $701.00 | $679.00 | -3.1% | -$22.00 |
This week, only gold ended the week higher than last week’s close. Palladium had the largest differential in both percentage and actual dollars. But, again, palladium is interesting overall. When you look at the 30-day chart, palladium shows the least volatility for the month.
Now, we have the rest of the holiday shopping season just ahead and the economic concerns with Black Friday and Cyber Monday. Did people get leery of the market’s volatility on Friday and pull out of the metals before any shopping results were announced? Or, could the metals’ options expiring provide the downward trend?
The next week’s metals’ values will be impacted to some degree by the initial shopping results and the economic situations domestically and around the globe. (For example, the EU countries are having their own challenges with banks and housing.)
Stay tuned to see how the market fares.


