Are you familiar with those bobble head dolls that people sometimes place in their cars or perhaps on their desks? The ones that if the head is touched or if the doll is in a moving vehicle, the head moves up and down seemingly forever? Yes, those dolls.
This week, anyone watching the metals had to feel like one of those dolls with the head moving up one minute and down the next then vice versa as the metals’ prices vacillated sporadically.
Let’s look at the 30 day performance charts with gold up first:
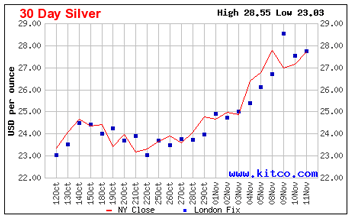
Next there’s silver (lots of bobbing up and down with silver, more details below):
Third is platinum (more negatively volatile than the other metals):
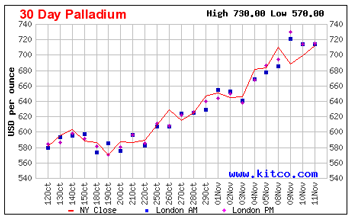
Last is palladium (another fun metal to watch):
Notice that these charts do not show today, Friday. It’s good they don’t. because the red lines would be headed downward. Lines pointing downward depress some people, but for the rest of us, many commodities and investment pundits fully expect the metals to rise more throughout the remainder of the year.
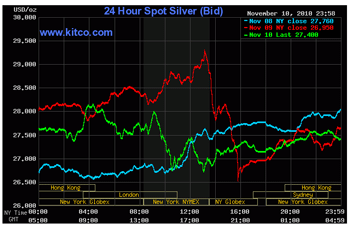
To illustrate the ups and downs of the market, let’s take a look at the daily performances for silver during the week.
This first chart shows Monday through Wednesday. (Blue is Monday, red is Tuesday and Green is Wednesday.)
Just look at Tuesday (red). Within a two hour window, the rate rose to over $29.50 then fell almost to $26.50.
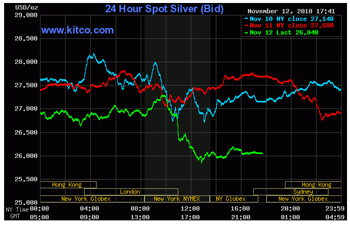
The next chart shows silver for Wednesday, Thursday and Friday. (Here, Wednesday is blue, Thursday is red and Friday is green.)
Wednesday and Thursday seem to be less volatile, but then on Friday afternoon, silver drops again to end the week right at $26.00.
Let’s look at the actual tables for the metals:
| 30 day high | 30 day low | Nov 12 Last | Difference between High and Low |
|
| Gold | $1,421.00 | $1,319.00 | $1,368.80 | 7.2% |
| Silver | $28.55 | $23.03 | $26.06 | 19.3% |
| Platinum | $1,786.00 | $1,661.00 | $1,666.00 | 7.0% |
| Palladium | $730.00 | $570.00 | $676.00 | 21.9% |
Both silver and palladium enjoyed the biggest differences between their highs and lows for the 30 day period.
As for today’s closing numbers, they’re not good in comparison to last Friday:
| Nov 5 Last | Nov 12 Last | Percent Change | Dollar Change |
|
| Gold | $1,394.10 | $1,368.80 | -1.8% | -$25.30 |
| Silver | $26.76 | $26.06 | -2.6% | -$0.70 |
| Platinum | $1,767.00 | $1,666.00 | -5.7% | -$101.00 |
| Palladium | $683.00 | $676.00 | -1.0% | -$7.00 |
This time, platinum experienced the biggest difference in both percentage and dollar values between today’s close and last Friday’s close. And, though gold, silver and palladium experienced highs this week, their comparisons to last Friday are less than platinum’s.
The metals next week will continue providing excitement for those of us who watch. Though, we probably should be prepared for more bobbing like a bobble head doll.


